Tools / Honeybadger
About Honeybadger
Track production errors, query logs, and watch app performance from one dashboard. Works with Ruby, Python, PHP, Elixir, Go, and more.
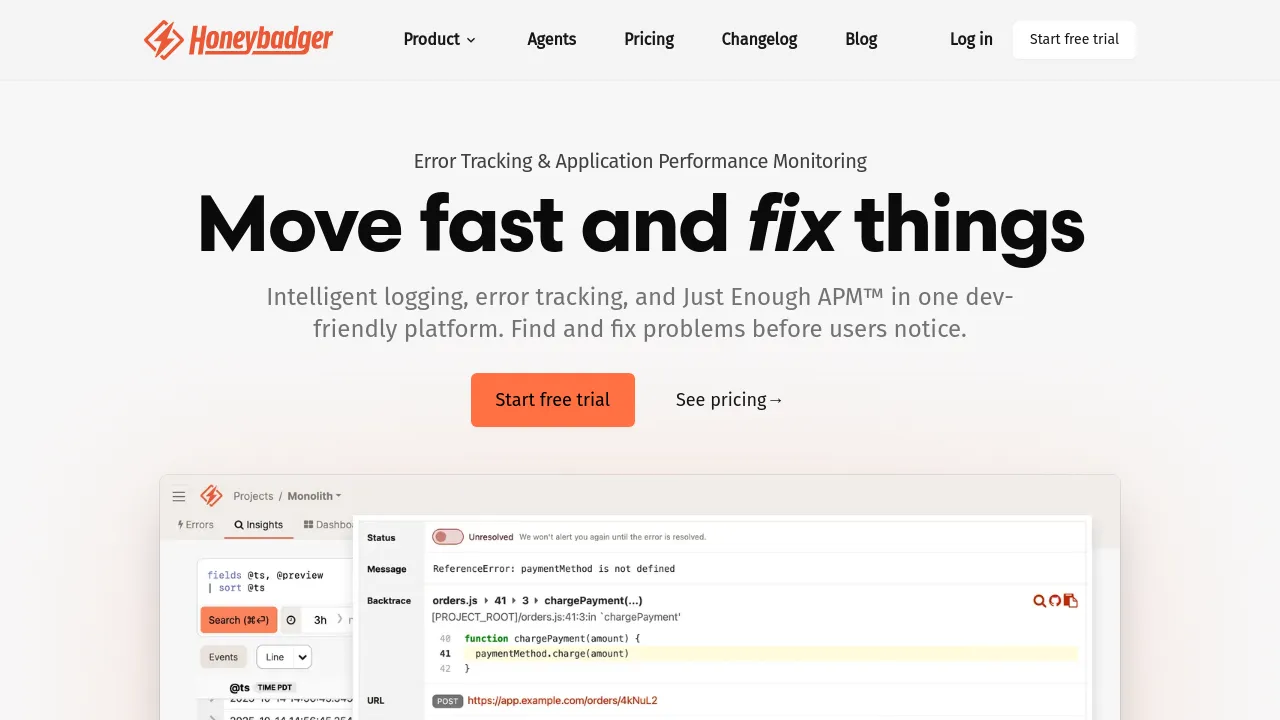
Honeybadger is an error tracking and application monitoring platform aimed at developers who support web apps in production. It bundles three things into one interface: error tracking with real-time alerts and de-duplication, a logging product that ties log events to the errors they relate to, and what the company calls "Just Enough APM" — performance dashboards with fewer knobs than full observability suites. The pitch is that a small team can find and fix problems before users notice without stitching together several tools.
The company behind it is a small bootstrapped team founded in 2012 by Joshua Wood and Benjamin Curtis. They position the product against feature-heavy enterprise platforms and say they build for developers rather than chasing growth targets. Companies listed on the site include DigitalOcean, Wistia, Zappos, Thoughtbot, and Workable.
Setup is SDK-based. For a Rails app it takes two terminal commands — bundle add honeybadger, then bundle exec honeybadger install with your API key — and the site says you can be up and running in a few minutes. Beyond Ruby, there are integrations for Python/Django, PHP/Laravel, Elixir/Phoenix, JavaScript, Node.js, Go, Java, .NET, Crystal, and Cocoa. Incoming errors carry context like the URL and browser version, duplicate reports get grouped automatically, and structured logs can be queried alongside them.
A newer addition is an MCP plugin for coding agents. Claude Code, Codex, Amp, Pi, OpenCode, or any MCP client can investigate errors, run log queries, and build dashboards next to your code — the site's demo shows an agent resolving a fault and leaving a comment linking the deploy that fixed it. You can start the agent in read-only mode and grant write access when you trust it.
Best for
- Small teams that want errors, logs, and basic APM in one tool instead of a multi-vendor stack
- Ruby on Rails shops — the install is two commands and Rails is the flagship integration
- Polyglot teams shipping Django, Laravel, Phoenix, Node, Go, Java, or .NET services
- Developers using AI coding agents who want the agent to pull error data and query logs directly
- Teams already running Datadog or New Relic who want lighter app-level monitoring alongside them
Frequently asked questions
Which languages and frameworks does Honeybadger support?
Ruby on Rails, Python/Django, PHP/Laravel, Elixir/Phoenix, JavaScript, Node.js, Go, Java, .NET, Crystal, and Cocoa, among others. The full SDK list is in their developer docs.
How long does installation take?
The site says a few minutes with sensible defaults. For Rails it is literally two commands: add the gem, then run the installer with your API key.
Does Honeybadger replace Datadog or New Relic?
Not necessarily. The site says its APM "plays well with New Relic and Datadog," so you can run it alongside them, or use it as a lighter-weight alternative if you don't need full observability suites.
Can AI coding agents work with Honeybadger?
Yes. An MCP plugin lets agents like Claude Code, Codex, Amp, Pi, and OpenCode investigate errors, query logs, update faults, and create dashboards. It ships with skills for debugging, incident investigation, and alert setup, and supports a read-only starting mode.
How much does Honeybadger cost?
The homepage doesn't list pricing. Check honeybadger.io for current plans.
What kind of support is available?
The company offers developer-led support via email (support@honeybadger.io) and says customers get replies from its own dev team.
Alternatives
- Sentry — if you want the largest error-tracking ecosystem with broad performance tracing.
- Datadog — if you need full-stack observability including infrastructure metrics, not just app-level monitoring.
- Better Stack — if uptime monitoring, incident management, and status pages are your main need.
- LogRocket — if you want session replay to see exactly what users experienced alongside errors.
- Axiom — if high log volume is the priority and per-GB pricing matters.

Similar to Honeybadger
New tools, once a week.
One weekly email with curated tools and founder insights. Unsubscribe anytime. Check our privacy policy.