Categories / Business Intelligence
Business intelligence
A curated collection of the best dashboards and reporting tools that analysts and business teams use to turn company data into charts and numbers they can act on — 21 tools on Founderkit.
21 tools
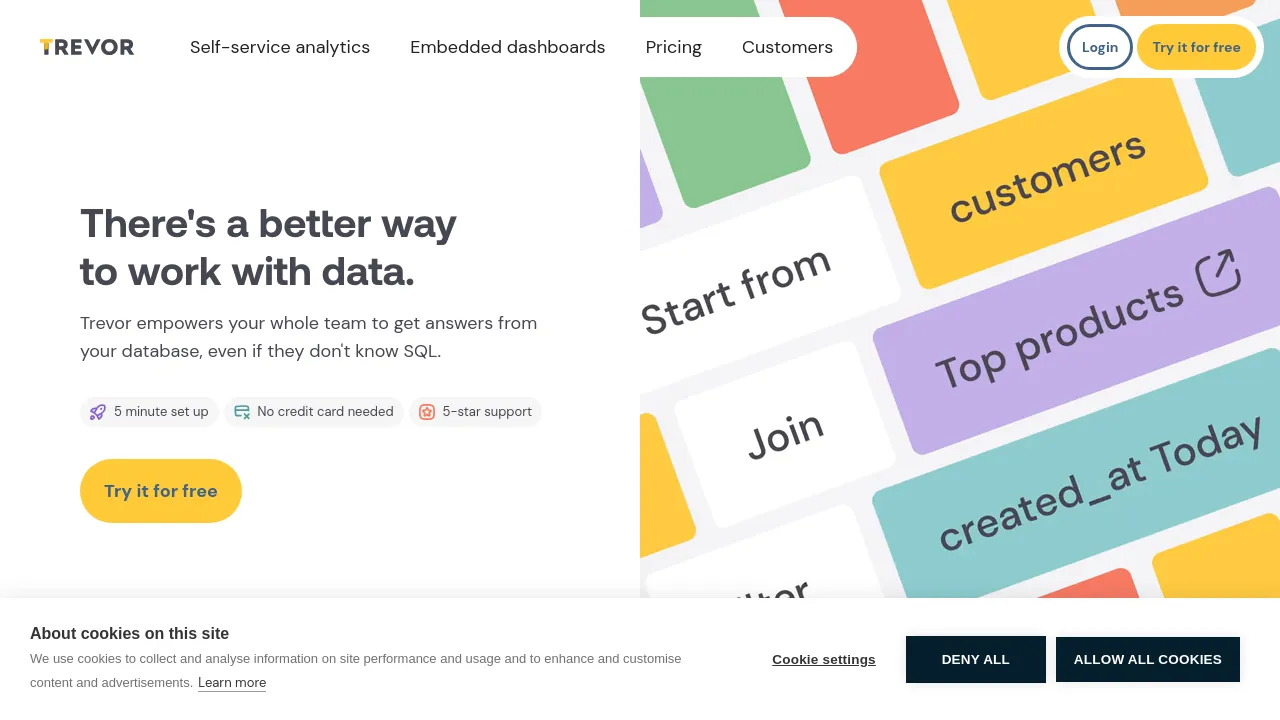
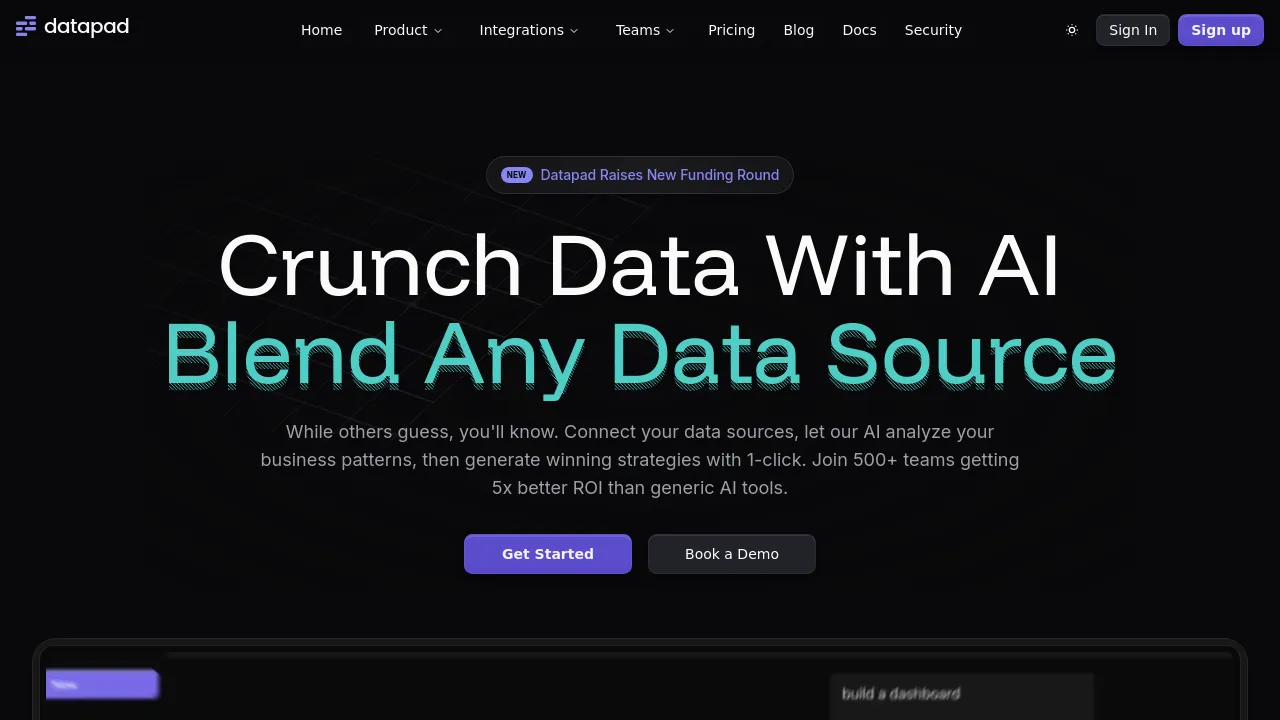
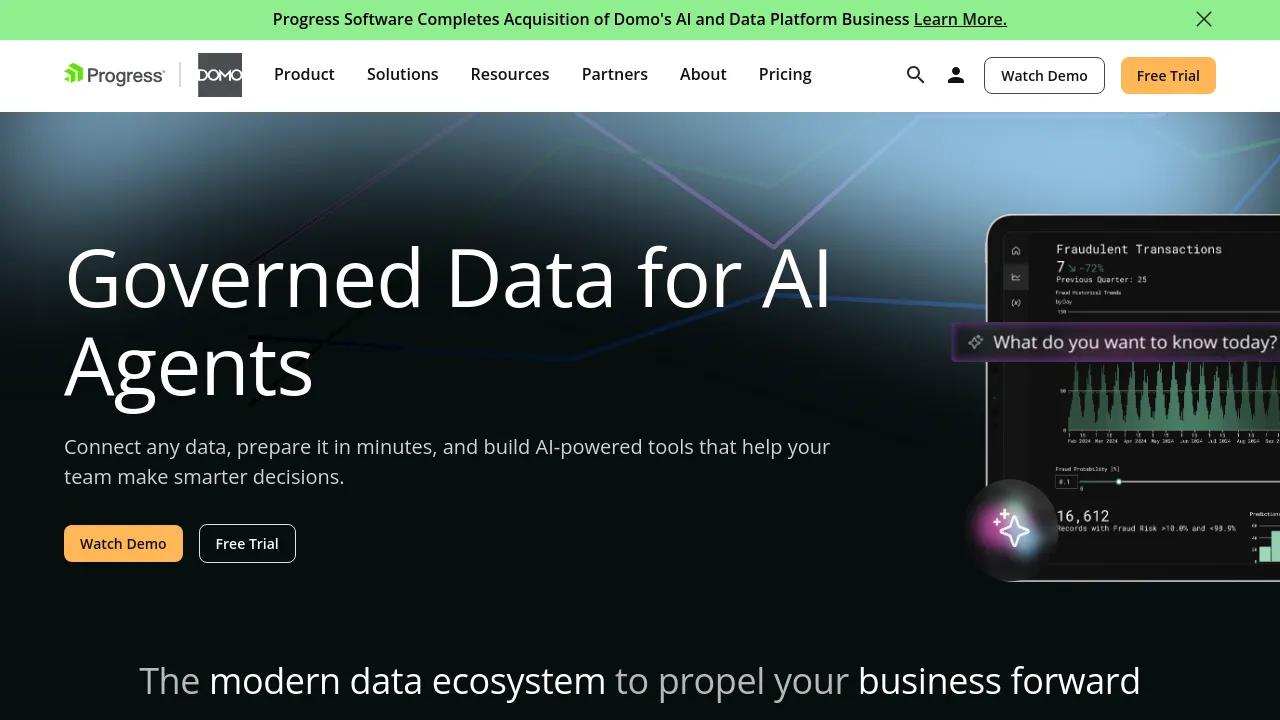
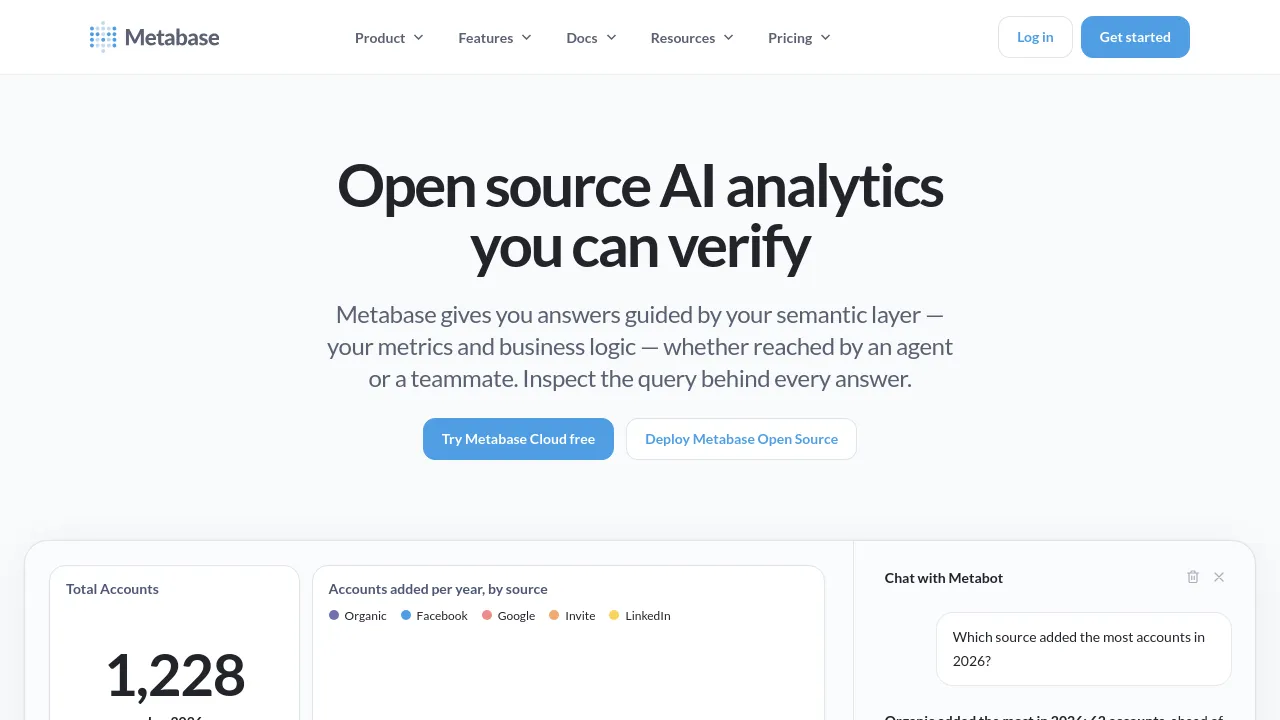

Business intelligence tools connect to your databases and warehouses, let you model the data, and turn it into dashboards, reports, and ad-hoc answers for the people asking "how are we doing?" The category spans lightweight dashboard builders to full platforms with semantic layers and governed metrics.
The hard part of BI was never the charts — it's the definitions. When 'active user' means three different things in three different reports, dashboards make the confusion prettier, not smaller. Modern tools lean on a semantic or metrics layer to define things once, and increasingly let people ask questions in plain language on top of that governed model.
When choosing, match complexity to your data maturity. If everything lives in one Postgres, a simple SQL-to-chart tool beats an enterprise platform. Check who the audience is — analysts writing SQL or ops folks clicking filters — and how pricing scales, since per-viewer costs surprise people when a dashboard gets popular.
Frequently asked questions
- When does a startup need a real BI tool?
- When the same questions keep coming up and someone's hand-writing SQL or spreadsheet exports every week to answer them. If fewer than three people look at metrics regularly, a saved query or a lightweight dashboard is enough; BI earns its complexity when metrics are a shared language.
- What's a 'semantic layer' and do I need one?
- It's the definition layer between your raw tables and your charts — 'revenue' defined once so every report agrees on it. You need it when different teams produce different numbers for the same metric. Before that, it's overhead; after that, it's the thing that makes BI trustworthy.
- Can non-technical people actually self-serve from BI tools?
- From the modern ones, mostly yes — dashboards, saved questions, and natural-language querying genuinely work for simple questions. The catch is the data model underneath: someone still has to set it up correctly or self-serve just produces confident wrong answers.
- BI vs. product analytics — do I need both?
- They answer different questions. Product analytics (Mixpanel, Amplitude) tracks in-app user behavior — funnels, retention, feature usage. BI queries your business data — revenue, pipeline, operations. Startups usually need product analytics first; BI follows when finance and ops questions outgrow spreadsheets.
New tools, once a week.
One weekly email with curated tools and founder insights. Unsubscribe anytime. Check our privacy policy.